Nigeria · Energy · Capital markets
Dangote’s $47 Billion Valuation
Can Africa’s biggest IPO transform Nigeria’s economy?

Executive summary
01 / A real economic change. Local refining retains industrial value in Nigeria, but gross import savings overstate the improvement in its external accounts.
02 / Exceptional earnings need a discount. Nine-month EBITDA reached $5.52bn; global supply disruptions helped. Cash generation and through-cycle margins matter more than the headline growth.
03 / The price already asks a lot. At ₦525, post-offer equity value is about $47.82bn on the prospectus exchange-rate convention. My illustrative base case, including expansion, offers little upside.
The producer that bought its petrol back
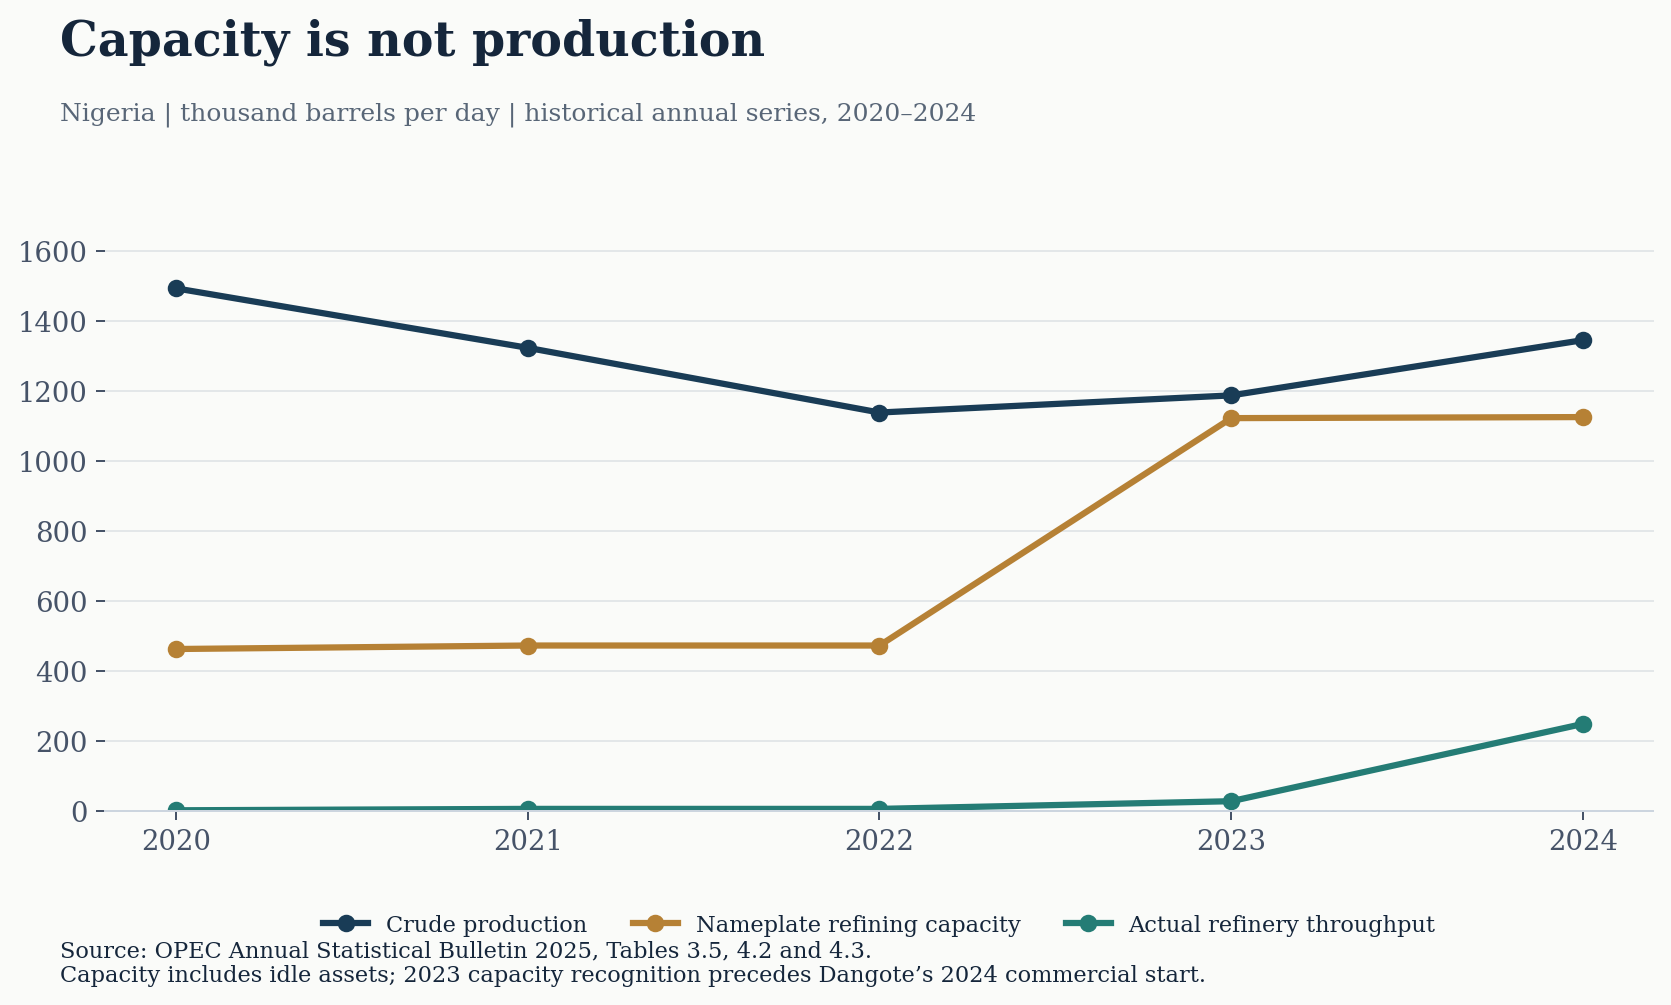
Nigeria spent decades exporting crude and importing the ability to use it. The missing link was not oil underground, but dependable industrial capacity above it.
Maintenance failures, underinvestment and weak operation of public refineries left nominal capacity largely unusable. Imports filled the gap; subsidised fuel prices transferred part of the cost to public finances. Dangote changes where the barrel is processed. Whether it changes who earns an attractive return is a separate question.
A $47 billion valuation, not a $47 billion cheque
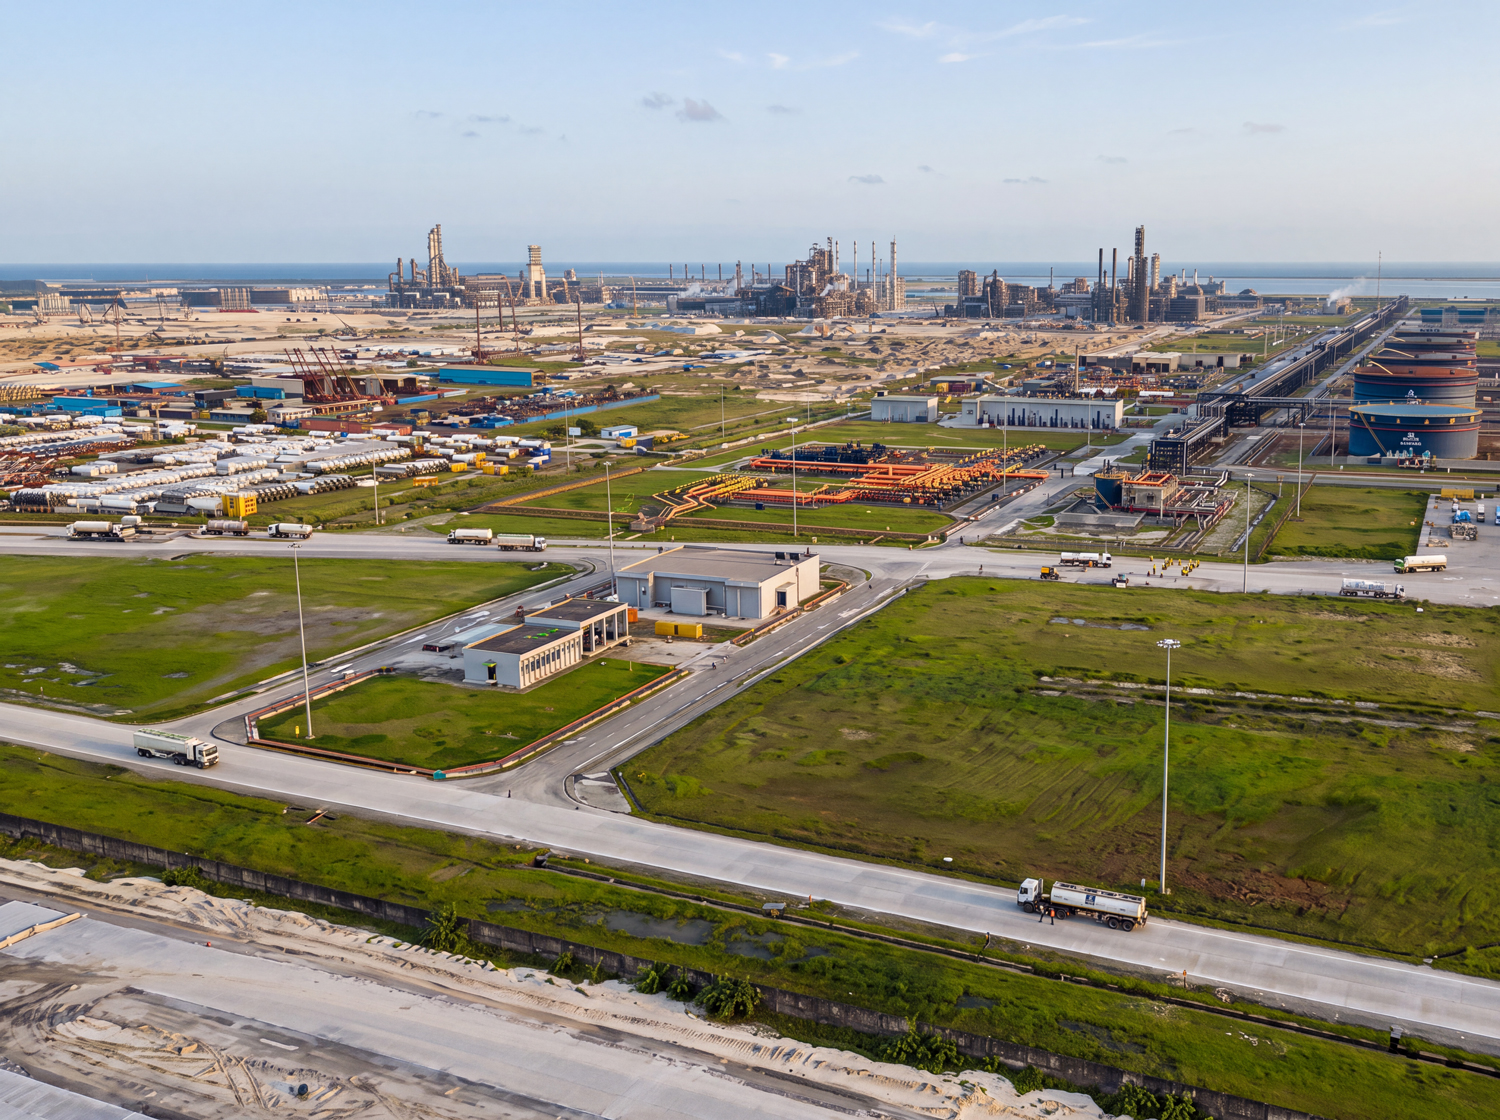
Aliko Dangote’s move from cement and sugar into petroleum extends an industrial strategy built around supplying large domestic markets. Commercial refining began in 2024. The listing now offers public investors a small stake in a strategically important, highly concentrated business.
| Issuer / venue | Dangote Petroleum Refinery & Petrochemicals FZE / proposed NGX Main Board |
|---|---|
| Offer | 4.10bn new shares at ₦525; minimum 10 shares |
| Gross / net proceeds | ₦2.1525tn / ₦2.1110tn; approximately $1.58bn / $1.55bn at ₦1,364/$ |
| Shares after full subscription | 124.2289bn; offer represents 3.30% |
| Equity value | ₦65.2202tn post-offer, or $47.82bn at the prospectus reference FX; pre-offer ₦63.0677tn |
| Offer window / trading | Opened 14 September; extended close 27 October. Original timetable: trading 15 business days after allotment; no revised fixed listing date verified. |
| Operating capacity | 700,000 bpd rerated nameplate; original design 650,000 bpd |
| Expansion ambition | 1.4m bpd; approximately $14.3bn total programme. Management targets 2029; detailed prospectus text also refers to 2030. |
Sources: prospectus, pp. 32–36, 118 and 156; SEC notice; issuer’s extension announcement. USD translations are analytical conversions, not an executable October exchange rate.
This is primary capital for expansion, not simply an owner cashing out. The offer is not underwritten. Three named Dangote-linked vehicles collectively hold 87.24% before the offer, approximately 84.36% after full subscription; NNPC’s 6.815% becomes approximately 6.59%. These are calculated, rounded holdings, excluding any additional beneficial ownership within “Others”. Earlier reports of a $5bn fundraising are not the final offer terms.
Import substitution is only half the external-account story
Oil remains central to Nigeria’s foreign-currency earnings even though it is not most of GDP. The 2023 subsidy and exchange-rate reforms exposed households to more of the international fuel price and the cost of a weaker naira. September 2026 inflation was still 14.63% year on year: slower inflation does not reverse the accumulated increase in living costs.
The external benefit is visible. CBN figures reported by Channels Television put refined-product imports at $10.00bn in 2025, down from $14.06bn. Yet the current-account surplus fell from $19.03bn to $14.04bn. Dangote itself imported $3.74bn of crude and exported $5.85bn of products. Those figures describe different flows; adding them into a claimed “FX saving” would be misleading.
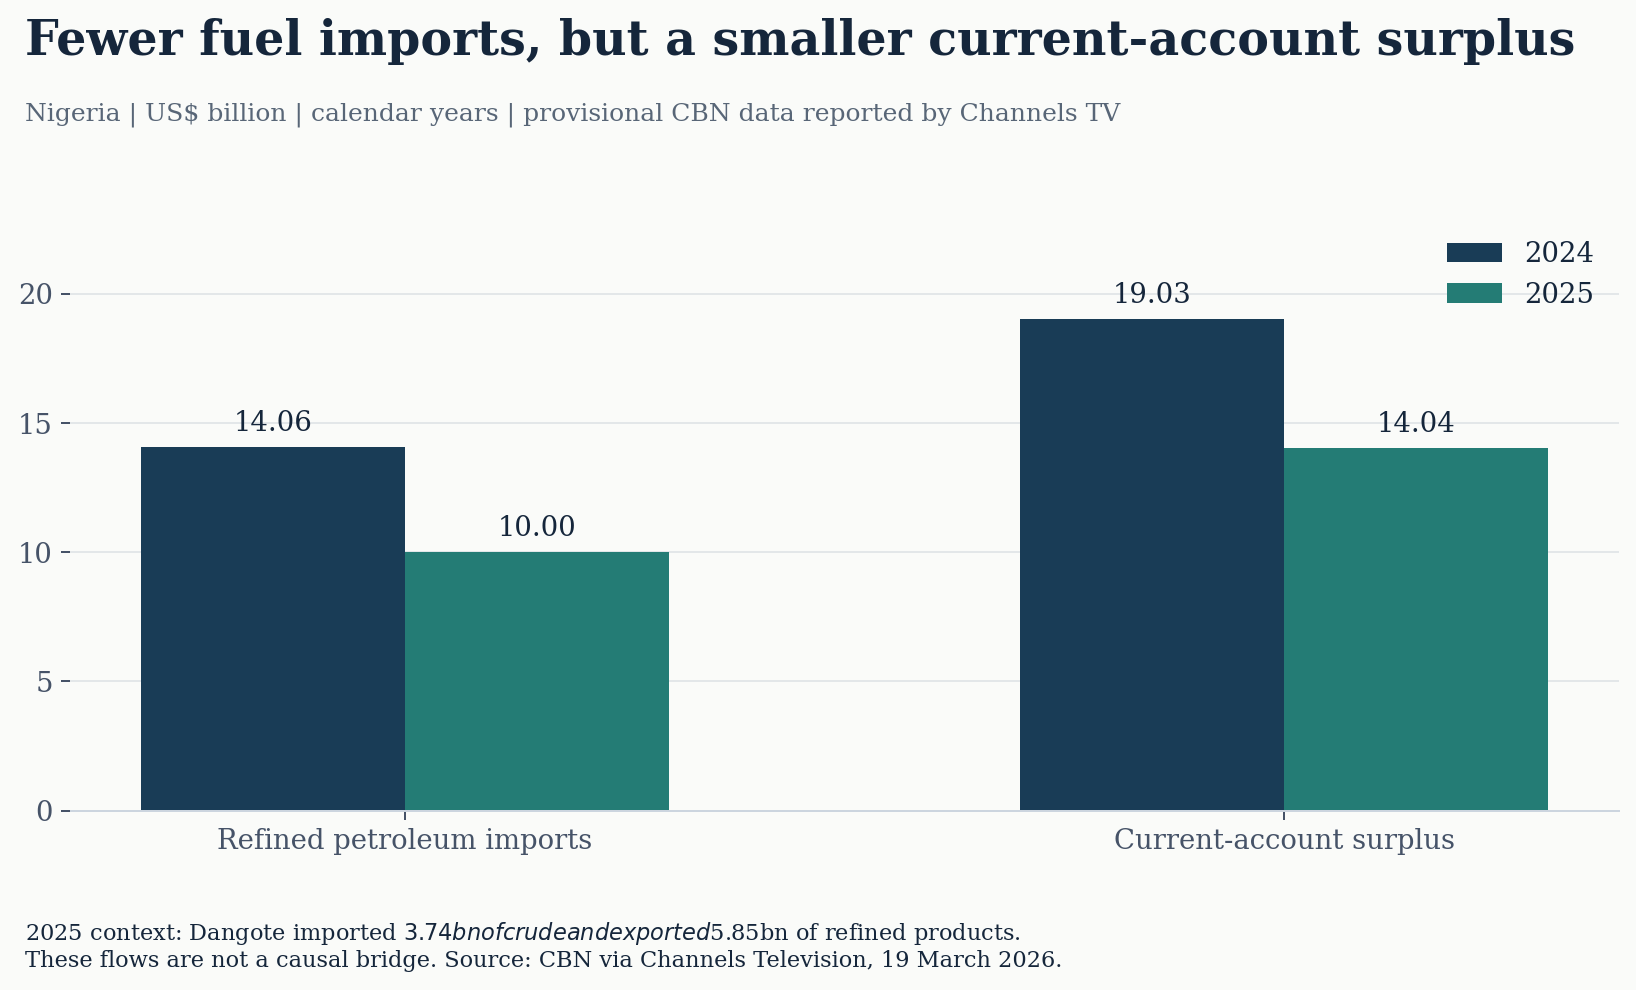
For locally sourced crude, the counterfactual includes export receipts forgone. For imported crude, it includes a new import bill. The gain is principally the refining value added, freight efficiencies and associated domestic services, less imported inputs and foreign income claims. Interest and profits accruing to non-residents affect the current account; repayment of debt principal belongs in the financial account. Both can consume foreign currency.
The IMF’s 2026 consultation also identifies lower fuel imports as support for the external position. The World Bank’s October outlook expects growth to average 4.4% through 2028, conditional on continued reform. Industrial investment helps, but policy credibility remains part of the equity thesis.
The IMF’s 2025 analysis estimated a roughly $5.5bn potential current-account improvement from the refinery, an ex-ante assessment rather than a realised saving. One refinery can therefore matter materially. It cannot guarantee currency stability, restore fiscal discipline or diversify export earnings away from the petroleum cycle. It diversifies Nigeria’s productive capabilities within oil.
Operating leverage meets an unusually favourable market
The latest available update covers the nine months to September 2026 and is unaudited. Revenue was $22.48bn versus $9.19bn; EBITDA $5.52bn versus $627.6m; operating cash flow $3.68bn versus $364.7m. EBITDA margin rose from 6.8% to 24.6%.
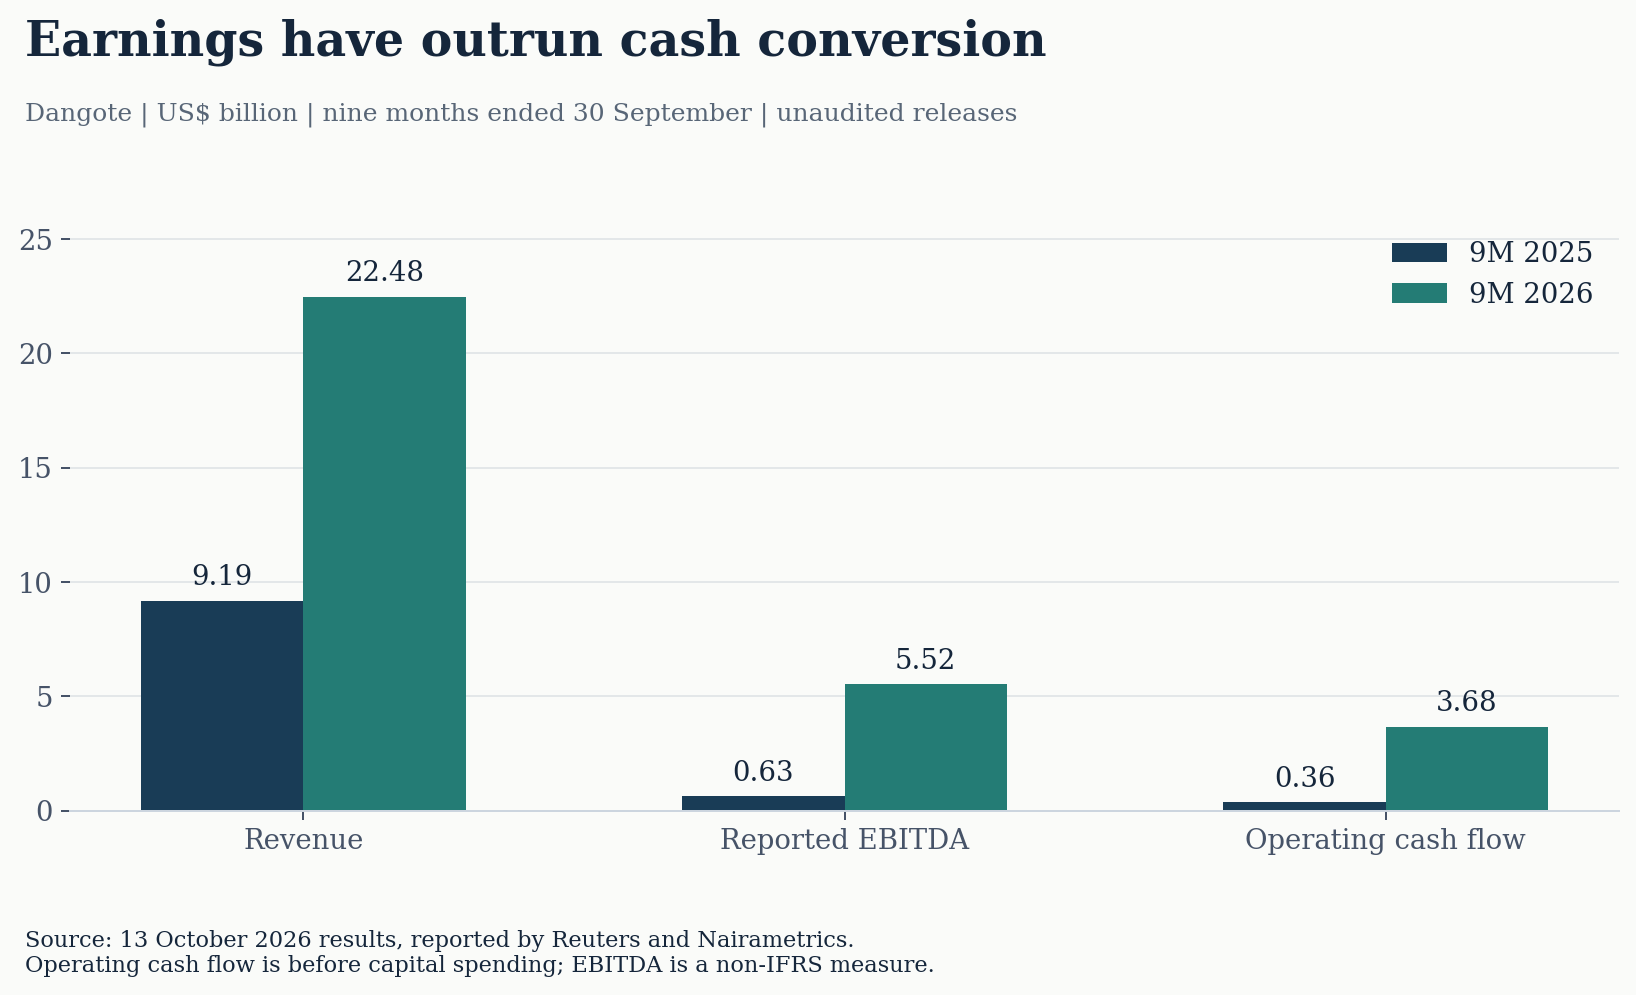
Higher utilisation spreads fixed costs across more barrels. But nameplate capacity is not average throughput: the 700,000-bpd figure reflects rerating after testing, not proof that every day’s production reached that level. A consistently defined nine-month average was not verified.
Gasoline, diesel and jet fuel represented approximately 42.5%, 25.2% and 23.7% of H1 revenue. Domestic demand provides a substantial outlet; exports offer optionality when overseas prices compensate for freight. The coast, storage and marine infrastructure matter because procurement and delivery economics can overwhelm a small processing-cost advantage. Domestic crude availability also depends on grades, existing export commitments, pricing and payment terms.
A crack spread measures the difference between refined-product and crude prices before the full cost of refining. Higher oil prices do not automatically widen that spread. A refinery benefits when its product basket rises faster than delivered feedstock and operating costs. Higher crude prices can instead absorb working capital or create inventory losses when prices subsequently fall.
Reuters links 2026 profits to disruptions in Middle Eastern supply and increased demand for exports. That scarcity premium should not be capitalised indefinitely. The nine-month operating-cash-flow/EBITDA ratio is only 66.7%, before capex. Reported net cash of $650.8m improves resilience, but $6.69bn of cash implies roughly $6.04bn of debt under that reported netting convention. It is not a debt-free business.
H1 audited operating cash flow was $1.273bn. Cash purchases of equipment and intangibles were $33.5m, plus $4.4m of right-of-use additions. These commissioning-era cash outlays are no guide to the expansion’s funding needs. I do not quote a nine-month free-cash-flow yield without a verified capex and cash-interest bridge.
What must the offer price earn?
The first discipline is to reconcile the share count and cash. Assuming full subscription, $47.815bn equity value − $0.651bn September net cash − $1.548bn net IPO proceeds = $45.617bn enterprise value. This is a pro-forma snapshot before subsequent cash movements, not a forecast closing balance sheet. Using June borrowings and cash instead gives $47.67bn EV after proceeds. No IPO proceeds are subtracted twice.
| Measure | Result | Interpretation |
|---|---|---|
| EV / 9M EBITDA | 8.26× | Nine-month denominator; not a standard annual multiple |
| EV / mechanically annualised 9M EBITDA | 6.20× | $7.36bn denominator; cyclical run rate, not normalised earnings |
| P/E, mechanically annualised 9M net profit | 7.58× | $4.73bn × 4/3; not a sustainable earnings estimate |
| EV / nameplate bpd | $65,167 | 700,000-bpd denominator; includes petrochemical and infrastructure value |
| Free cash flow yield | Not established | OCF is not distributable cash flow |
Low run-rate multiples can be most seductive near peak profitability. Valero, Marathon Petroleum and HF Sinclair also reported sharp Q2 improvements. Dangote’s ramp-up is company-specific; favourable refining conditions are not.
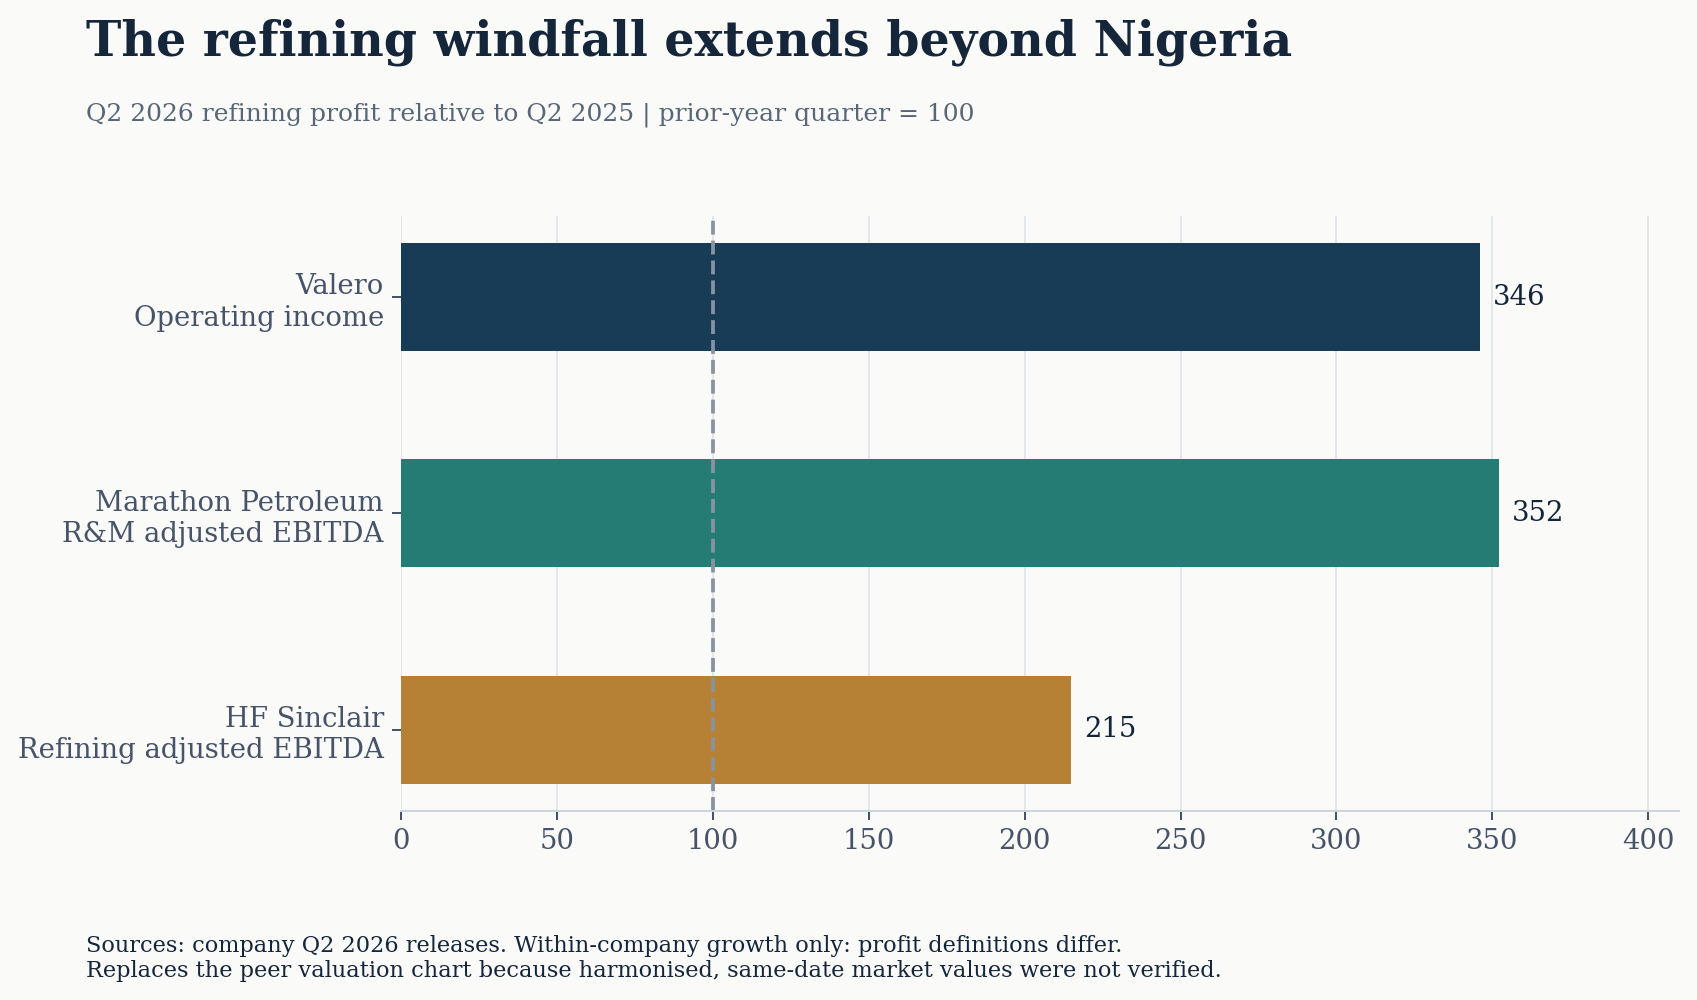
Valero’s international fleet offers geographic diversification; its renewable-fuel interests complicate consolidated comparisons. Marathon’s MPLX ownership requires matching minority interests, debt and EBITDA. HF Sinclair combines refining with lubricants, marketing and midstream. Thai Oil is a useful emerging-market comparator, but inventory effects and expansion financing also distort reported earnings. None warrants importing a headline multiple without adjustment.
Dangote deserves credit for modern scale, growth and proximity to regional demand. Against that stand single-site concentration, policy exposure, currency convertibility and an enormous reinvestment programme. Its dollar-linked revenues are partly matched by dollar-linked crude and financing costs; they do not eliminate an overseas shareholder’s currency and repatriation risk.
A valuation range with the assumptions exposed
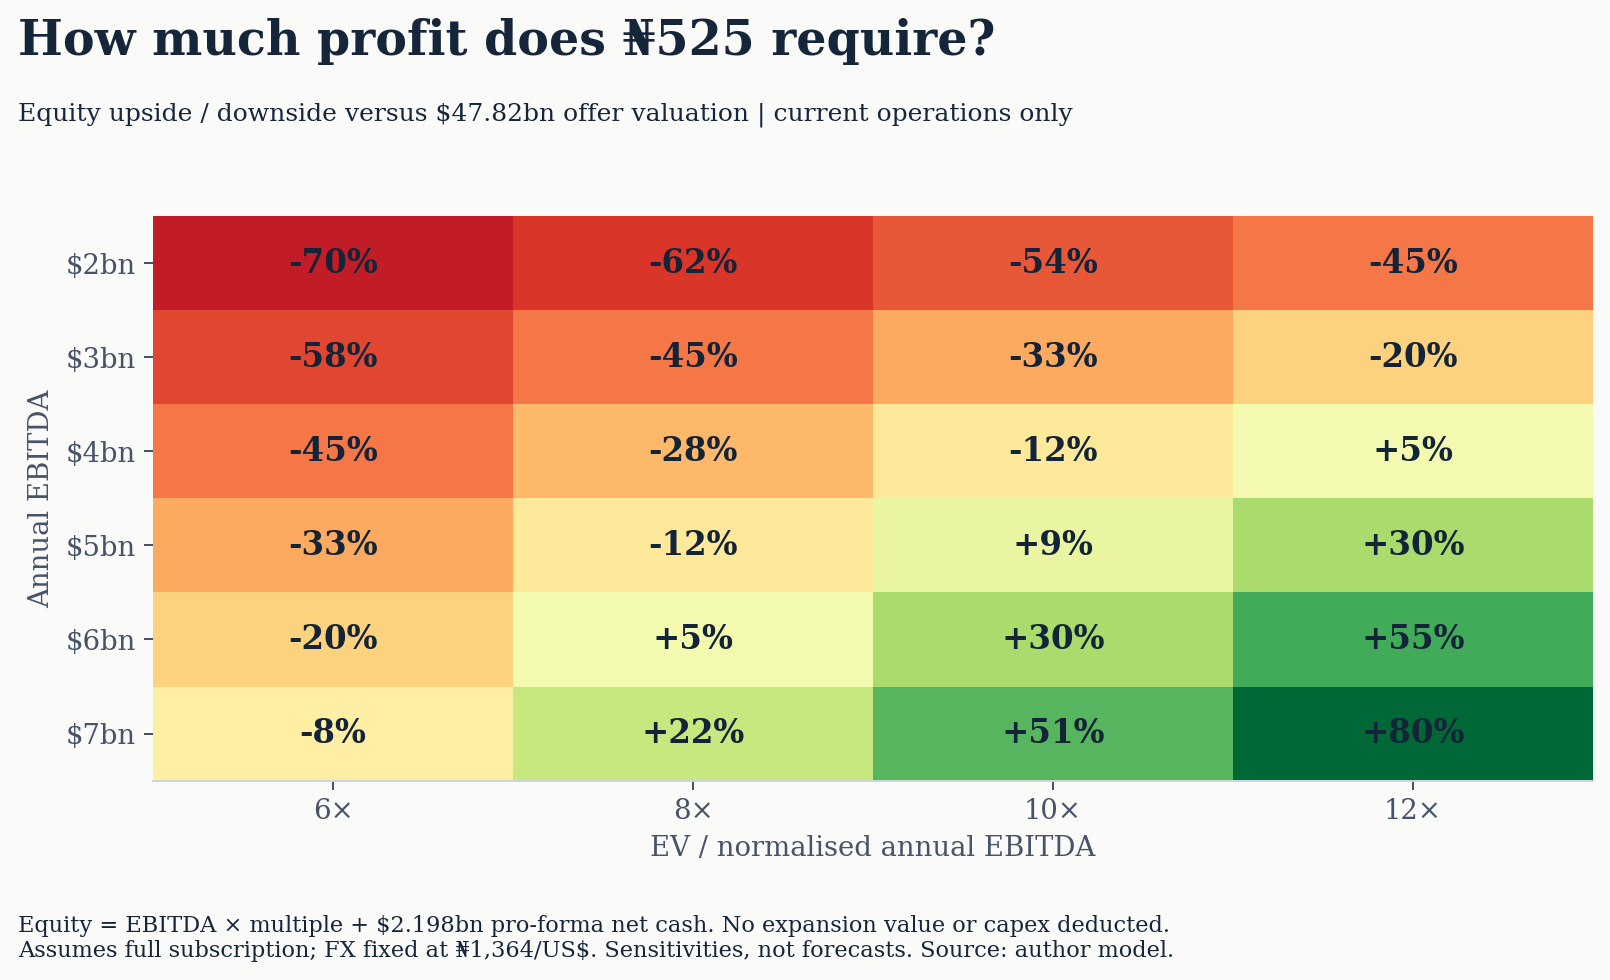
The framework below capitalises normalised earnings from today’s plant, then adds a separately discounted expansion value. It is an illustrative stress test, not management guidance or a detailed engineering DCF.
| Assumption / output | Bear | Base | Bull |
|---|---|---|---|
| Existing capacity / utilisation | 700k / 80% | 700k / 90% | 700k / 95% |
| Average throughput, thousand bpd | 560 | 630 | 665 |
| Revenue per feedstock barrel | $100 | $100 | $100 |
| EBITDA margin / annual EBITDA | 12% / $2.45 | 18% / $4.14 | 24% / $5.83 |
| Capitalisation / terminal multiple | 6× | 8× | 10× |
| Expansion USD discount rate | 18% | 15% | 12% |
| Incremental expansion NPV | −$1.38 | $10.91 | $30.04 |
| Total equity value | $15.53 | $46.22 | $90.49 |
| Value per share / versus ₦525 | ₦171 / −68% | ₦508 / −3% | ₦994 / +89% |
Revenue equals capacity × 365 × utilisation × $100. This price is an assumed realised basket per feedstock barrel, not a crude forecast; margins capture feedstock and operating costs. The additional 700,000 bpd earns the same unit economics at year three, with no interim project earnings. The full $14.269bn programme cost is charged evenly over three years and discounted alongside terminal value. Charging the entire cost prospectively is conservative if spending has already occurred; it is not a verified remaining-capex schedule.
Equity equals existing-plant EBITDA × multiple, plus expansion NPV and $2.198bn pro-forma net cash. Multiples and discount rates are analyst assumptions, not observed peer medians. Delay, overruns, lower margins or new equity issuance would reduce these values. The base case depends on expansion: current operations alone produce approximately ₦388 per share.
A deeper market, or a larger concentration?
Nigeria’s stock market has a longer history than the frontier-market label might suggest. Founded in 1960, the Lagos Stock Exchange began trading in 1961 with just 19 securities and became the Nigerian Stock Exchange in 1977. In 2021, demutualisation converted the member-owned institution into a shareholder-owned group, separating exchange operations from its regulatory subsidiary. Dangote’s listing belongs to this broader evolution: the opportunity is to turn an established trading venue into a deeper source of long-term industrial finance. Its success should be judged by sustained liquidity, wider participation and investor confidence, not simply the size of the company admitted.
The investment opportunity is credible: regional fuel demand, import substitution and logistics scale can support a durable industrial franchise. The opposing case is equally concrete. Public pressure for affordable petrol can conflict with shareholder margins; crude allocation can become political; one serious outage can interrupt much of the earnings base.
Control also matters. A small public float cannot meaningfully constrain a dominant sponsor. Investors should scrutinise related-party procurement and hedging, board independence, distributions, future dilution and enforcement of minority rights. Strategic importance can increase the probability of government intervention precisely when profitability becomes politically uncomfortable.
The listing could broaden participation, improve disclosure and establish a financing precedent for African industrial projects. But market capitalisation is not market liquidity. A roughly 3.3% new-share offer creates far less tradable supply than the headline valuation suggests. Index concentration and flows into related Dangote businesses could amplify common shocks. Foreign subscriptions bring capital only to the extent they attract new external savings, rather than reshuffle existing Nigerian portfolios.
My investment perspective
Dangote represents a genuine structural change in what Nigeria can manufacture. That does not make the IPO attractive at any price. At ₦525, the base framework offers little margin for mistakes and requires material expansion value.
A price around ₦380 or below, roughly 25% beneath the illustrative ₦508 base value, would merit closer investigation if 90% utilisation and an 18% through-cycle EBITDA margin proved defensible. This is a valuation hurdle, not a trading target. At the offer price, I would want stronger evidence of sustainable cash generation, executable expansion financing and protection for minority owners.
Nigeria needs the refinery to work; investors need the price to work too.
Sources, definitions and reproducibility
Research cut-off: 20 October 2026. All dollars are US dollars; bn = billion, tn = trillion; bpd = barrels per day. Financial years end in December. H1 covers January–June; 9M covers January–September. EBITDA is earnings before interest, tax, depreciation and amortisation, a non-IFRS measure; reported definitions and adjustments can differ across companies. EV is equity value plus net debt. Figures are rounded.
The prospectus provides audited H1 statements. The 9M figures are taken from public reporting of the unaudited release; the full underlying 9M statements were not obtained. Lease, restricted-cash and other debt-like adjustments could alter EV. No 2026 full-year actuals, verified current peer multiples or assured listing date are implied. The historical capacity chart deliberately ends in 2024 rather than splice incompatible newer series.
AI assisted with source discovery, calculations, charts and drafting. Sources and model assumptions are exposed for review. This is an independent educational research note, not an offer or personalised investment advice.
- US EIA, Nigeria country analysis; public refinery operating constraints
- OPEC, Annual Statistical Bulletin 2025; Tables 3.5, 4.2 and 4.3 (2020–2024)
- Dangote prospectus dated 7 September 2026, hosted by receiving agent GTI; pp. 16–17, 32–36, 74–93, 118, 134–159
- Nigerian SEC, notice confirming approval of the offer opening 14 September
- Dangote, official extension to 27 October 2026
- Reuters, 3 September 2026: earlier fundraising expectations
- Reuters, 15 October 2026, reporting NBS September inflation
- Channels Television, 19 March 2026, reporting the CBN 2025 balance of payments
- IMF, Nigeria 2025 Article IV; refinery external-account analysis
- Nairametrics, 13 October 2026, nine-month unaudited results
- Reuters, 13 October 2026, results and supply-disruption context
- Valero, Q2 2026 results, 30 July 2026
- Marathon Petroleum, Q2 2026 results and segment reconciliations
- HF Sinclair, Q2 2026 results and refining EBITDA reconciliation
- Thai Oil, Q2 2026 results: inventory losses and policy-related liquidity pressures
- IMF, Nigeria 2026 Article IV consultation
- Reuters, 8 October 2026, World Bank growth outlook
- NGX Group, 60th anniversary history, 25 August 2021: founding, first trading and demutualisation
- NGX Group, institutional history: the 1977 name change and 2021 restructuring